CRANE

Inside CRANE

Powered by Genesis

Fueling the State

“Fueling the State,” a project of CRANE’s partners at Durham University in the UK, is an investigation into the properties of fuel sources that might have been used to produce pottery during the Early Bronze Age II and III. Dr. Kamal Badreshany, who spearheads the project with Prof. Graham Philip, explains that “there was a great increase in craft production” during the period, and so ceramics are among the best resources we have to understand socio-economic change. There have been relatively few studies of the fuel consumption associated with it.

The project has two basic components or sub-projects. One involves testing the different fuel sources available in the period, and the other involves reconstructing the pottery that those fuels were used to create.

A replica of an Early Bronze Age storage transport jar (Photo: courtesy of Kamal Badreshany).

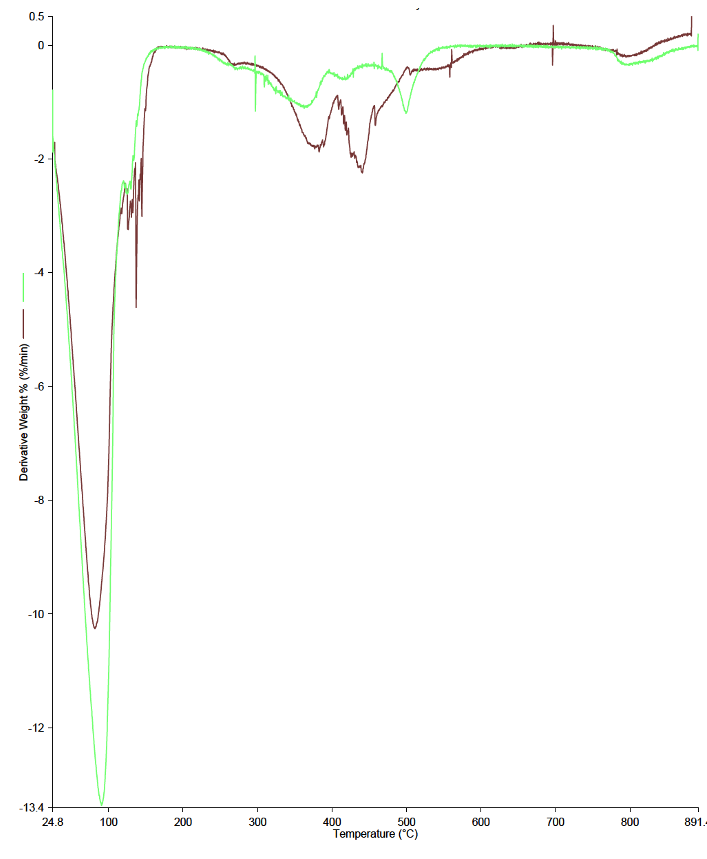
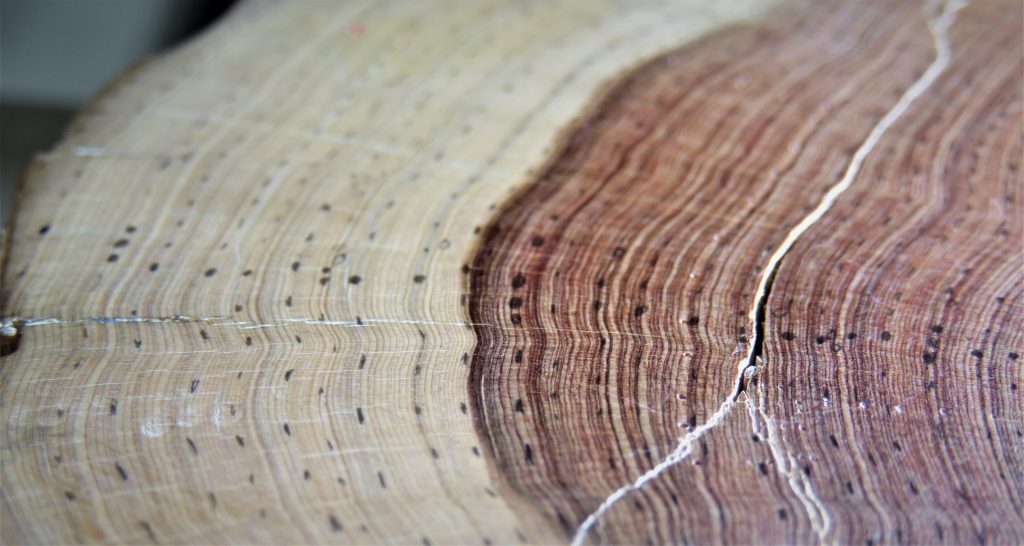
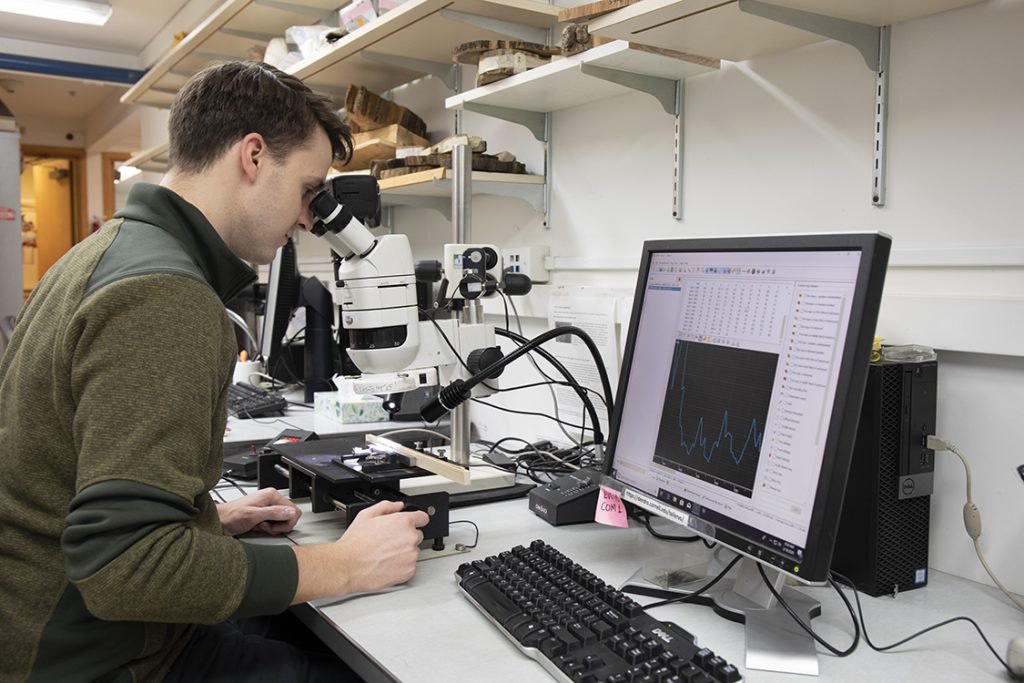
As part of the first component, Badreshany, Philip and their colleagues, who include Professor Chris Greenwell (Durham Earth Sciences) and undergraduate assistant Alice Slattery (Durham Earth Sciences), have run tests on many types of wood that could have been used as fuel in that period, as well as other fuel sources such as olive pressing waste and dung (“That’s quite an important one,” Badreshany says). To get a better understanding of how these fuels would have operated under real-world conditions, they use Thermogravimetric Analysis (TGA) to study how much heat it would have needed to ignite, energy release profiles, and how long it would have taken for the fuel to burn out.

Badreshany says they are finding that while wood was generally the best fuel available, waste from the production of olive oil would also have been very effective, suggesting possible links between industries: people who produced olive products might have been happy for the waste to be used as fuel, “because it is a potential environmental hazard and takes it off their hands.”

TGA profile of green olive cake (green) vs Black olive cake (brown), showing their burn characteristics (Image: courtesy of Kamal Badreshany).

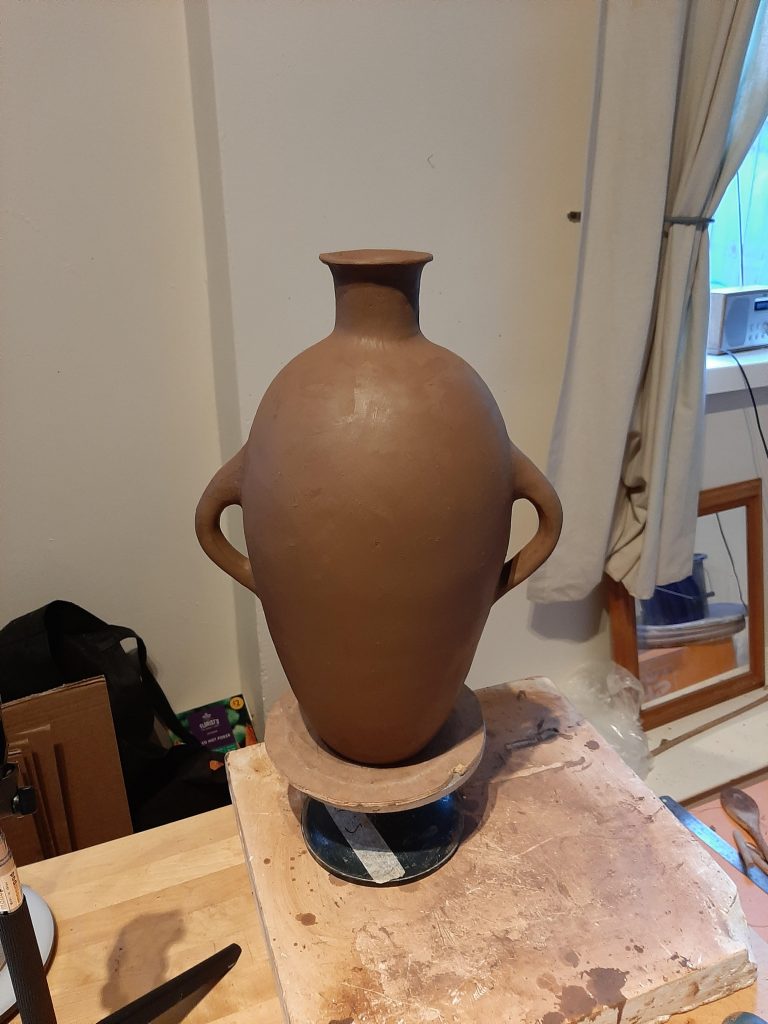
To get a better understanding of the ceramics themselves, the team has been working with experienced potters from the University of Sunderland, Rob Winter and Mary Watson. Badreshany has determined clay/temper mixes used in a particular area. The team creates “clay test cones” based on their findings, which they then fire up at different temperatures. By observing how each temperature affects the clay, its temper, and geochemistry, they will have a stronger basis for determining the source of ancient pottery and its production methods, such as the firing-temperature used by the original potters. Fuel-type and temperature profiles are key to understanding the fuel consumption and resource management needs of the time.

The team is also doing some live experiments, trying to re-create the conditions under which the original fuels were used. Badreshany says that they were recently able to “actually burn them in a fire pit and videotape that.” This real-world experiment seemed to duplicate the laboratory results, but there is one type of fuel Badreshany says they’re already pretty clear about: “Dung works, but it’s really the worst one.”

Written by Jaime Weinman.

Read Arabic Text from a Map using Google Cloud Vision

By Jeff Blackadar

Reposted from Digital History Learning Journal, February 28, 2021.

I would like to work with Arabic language maps and this post sets up transcription of one map tile using Google Cloud Vision.

I am grateful to Dr Kristen Hopper and Dr. Dan Lawrence of Durham University and Dr. Hector Orengo of the University of Cambridge for sending me a set of georeferenced digital maps to work with. Thank you!

I’m working with a map titled Djeble, dated 1942 which is centered on Jableh, Syria.

Set up Google Cloud Vision

The steps to step up the project for Google Cloud Vision are in here. https://cloud.google.com/vision/docs/setup. I have repeated the information below based on the steps I took in case it’s useful. Skip to the next step if you followed all of the instructions in the setup.

In the Dashboard of Google Cloud Platform:

Create Project and give it a name.

Check that Billing is enabled.

Enable the API.

Register the new application to use Cloud Vision API.
Enable the API.
Get credentials to access the API.
Set the permissions for the credentials.

Download the credentials as a .json. Upload the .json file to a secure directory on Google drive separate from your code. Keep this private.

Results

Tile from the map. The red text represents what Google Cloud Vision was able to transcribe.

The program I used to do this is here: https://github.com/jeffblackadar/CRANE-CCAD-maps/blob/main/maps_ocr_google_cloud_vision_1_tile.ipynb

The above has errors and some transcriptions are missing. Still, this looks promising.

Notes about the program

In Google Colab I need to install google-cloud-vision to transcribe text and the other 3 packages to plot Arabic text.

!pip install --upgrade google-cloud-vision
!pip install arabic_reshaper
!pip install bidi
!pip install python-bidi

To transcribe Arabic text, Cloud Vision uses language_hints = “ar”. See https://cloud.google.com/vision/docs/languages.

    client = vision.ImageAnnotatorClient()

    with io.open(path, 'rb') as image_file:
        content = image_file.read()

    image = vision.Image(content=content)
    response = client.text_detection(
    image=image,
    image_context={"language_hints": ["ar"]},  
     )

To plot Arabic text, I used a font and the code below. Thanks to Stack Overflow. https://stackoverflow.com/questions/59896297/how-to-draw-arabic-text-on-the-image-using-cv2-puttextcorrectly-pythonopenc

fontpath = "/content/drive/MyDrive/crane_font/arial.ttf" # <== https://www.freefontspro.com/14454/arial.ttf  
font_pil = ImageFont.truetype(fontpath, 32)

img_pil = Image.fromarray(img)
draw = ImageDraw.Draw(img_pil)

for l in lines_of_text:
    print(l[0])
    pts = l[1]
    #This is needed to handle the Arabic text
    reshaped_text = arabic_reshaper.reshape(l[0])
    bidi_text = get_display(reshaped_text)
    draw.text((int(pts[0]), int(pts[1])),bidi_text, font = font_pil,fill=(255,0,0,255))

The next steps are process all of the tiles on the map. I also intend to process the tiles to remove some of the non-text elements on the map that confuse transcription.

The 13C Stable Isotopes Project

The 13C Stable Isotopes Project, undertaken starting in 2020 by CRANE’s institutional partner at Cornell University, is an ambitious attempt to look at changes in the ratio of stable carbon-13 to carbon-12 isotopes, and use them to understand climate in eras before modern climate records. “If somebody had written down meteorological records every day, we wouldn’t need to do this,” says Sturt Manning, Distinguished Professor of Arts and Sciences in Classics at Cornell University, and Director of the Cornell Tree Ring Laboratory, who co-supervises the project with Cornell Research Associate Brita Lorentzen. Since such records did not exist during CRANE’s period and area of interest, the next best thing is what Manning calls “environmental or natural archives” – the climate information written into nature, and especially into the annual growth rings of trees, since they can be dated precisely.

Phoenician juniper (Juniperus phoenicea) sample, heartwood-sapwood boundary and outer rings, from historic structure at Taybet Zaman in southern Jordan close to Petra (Courtesy of Prof. Sturt Manning).

The C-13 project builds on the work that has already been done at Cornell’s Tree Ring Laboratory to build up tree ring records from the CRANE region and periods of interest: “We’ve built a new 600-year record from a site in Northern Syria and other records from the east Mediterranean-Levant region,” Manning says, “so it’s because we have some of these records from the Bronze Age period that, now we can do this.” Beginning with the period lasting roughly 1450 to 750 BC, Manning and his colleagues are taking wood samples from archeological sites and examining the ratio of carbon isotopes within them, to find clues about what was going on in climate at the time. “If a plant is growing somewhere, and the climate changes to become more arid, for example,” Manning says, “that’s going to leave slight changes in the ratio of the carbon isotopes you will find in the plant.”

Once the COVID-19 pandemic ends and access to laboratories becomes less limited, the project will engage graduate and undergraduate students at Cornell and move ahead with more processing and measurements. With their help, the project will be able to collect the replicate data that are necessary to ensure a robust record and likely climate history.

Graduate student Liam McDonald working on tree-ring sample, Cornell Tree Ring Laboratory (Courtesy of Prof. Sturt Manning).

By building these detailed “proxy” climate records, it may become possible to get a better idea of how changes in climate correlate with changes in human civilization. Manning says that there have always been hypotheses for the rise and fall of civilizations: “Often you blame invaders, or migration, and then there was a move to start blaming sources like climate, or extraterrestrial impacts.” With the C-13 project’s high-resolution records, it will be possible to say definitively that some hypotheses don’t work, “and we can see if climate change is, or is not, a likely driver in some key cases.”

Written by Jaime Weinman.

Reading an Old Map, AI Style

By Jeff Blackadar

Reposted from Digital History Learning Journal, January 9, 2021.

Over the course of history, geography changes. Places signified on maps at one time can lose significance. Place names change and new ones emerge. This post is about reading a 19th century map to collect place names and position them geographically so they can be plotted on maps from other time periods to gain insight.

Below is a partial, georectified map of Union Township, Berks County Pennsylvania, 1876.[1]

Union Township, Berks County Pennsylvania, 1876.[1]

Microsoft’s Azure Cognitive Services can transcribe the text on the map, such as listed below. Dr. Shawn Graham documented how to set up Azure Cognitive Services. The python code I am using is linked at the end of the post.

H.Beard
F. Mostaller- 
H.Hirtint 
260 
SCHOOL DIST. 
H.Shingle 
Eisprung 
No. 1 
A. Wamsher
... etc.

For each line of text Azure Cognitive Services recognizes on the map, Azure returns coordinates of a rectangle in the image where the text appears. Here is the map with an overlay of recognized text:

Map with an overlay of computer recognized text. Each blue rectangle represents the region where Azure Cognitive Services found text.

This map is a georectified tif provided by Dr. Ben Carter. Given we have pixel x,y coordinates for the image and know its geographic coordinate reference system is 32129 we can transform the image pixel coordinates into geographic ones and save them in a shapefile. The shapefile can then be plotted on other maps, like below:

Line_text.shp plotted on a basemap.

I also plotted the line_text shapefile on ArcGIS on-line map viewer. I clicked Modify Map and zoomed to the area of interest:

Modify Map

I clicked, Add | Add Layer from File and selected the zip of the line_text shapefile to import it. ArcGIS has options to set the color of polygons and display labels.

Add Layer from File
Line_text.shp plotted on a basemap.
A close-up of a place labelled A. Wamsher in 1876.

As seen above, some places labelled in 1876 are not immediately evident on current maps. The place labelled A. Wamsher likely was a farm. Today this area is within Pennsylvania’s French Creek State Park. It appears to be a forest, perhaps second-growth.

Adding PAMAP Hillshade shows additional features. It’s speculation, but are the ridges and depressions shown on the hillshade image remains of A. Wamsher’s farm?

The map of A. Wamsher’s property with hillshade.

Below is an embedded version of the map.

The python notebook is on GitHub.

Thank you to Dr. Ben Carter for the map and idea. I appreciate the support of the Computational Creativity and Archaeological Data and Computational Research on the Ancient Near East projects.

[1] Davis, F. A., and H. L. Kochersperger. 1876. Illustrated Historical Atlas of Berks County, Penna. Union Township. Reading [Pa.]: Reading Pub. House.

USGenWeb Archives has a full image.

Editor’s note: Jeff Blackadar is an MA student in the Department of History, Carleton University, specializing in Data Science. He is working towards his degree under the supervision of Prof. Shawn Graham.

OrientDams: The Impact of Dams on Cultural Heritage in the Middle East and North Africa

By Nicolò Marchetti and Federico Zaina

Reposted from The Ancient Near East Today (December 2020)

Dams represent a controversial tool for economic development. Less contested is their impact on archaeological and heritage resources.

The rising water of the Atatürk dam generated the third largest lake in Turkey and submerged 191 archaeological sites. (Wikimedia commons)

It is widely agreed that in addition to water reserves, massive hydraulic infrastructures provide different types of benefits, such as the production of electricity, increased farmland brought by irrigation as well as developments of fishery and water-related industries. However, in addition to their maintenance costs, the construction and up-filling of dams entails potential political international issues when built on rivers flowing through different countries, the dislocation of thousands of people, the permanent loss of the best soils and the widespread destruction of both cultural and natural heritage. In the face of these permanent losses, dams have a finite lifespan ranging between 50 to 120 years.

Despite the concerns regarding the benefits and costs of dams, Middle East and North Africa (MENA) countries today are witnessing an ever-growing number of large-scale hydraulic infrastructure projects. New dams are being built in Turkey, Iraq and Iran, as well as in Egypt, Sudan and Ethiopia. Turkey represents one of the most relevant examples where development has often deeply threatened or damaged cultural and natural heritage. Since the late 1960s the construction of dams throughout the country caused the total or partial flooding of important ancient sites such as the Bronze, Iron, Hellenistic, Roman and Byzantine capital city of Samsat, the Roman city of Zeugma and the medieval towns of Hasankeyf and Halfeti. Today more than 600 dams are active in the country and almost 200 are under construction or in planning stage.

The main mound of the ancient city of Samsat in the process of being submerged by the raising water of the Atatürk dam. (Wikimedia commons)
Zeugma, 2002 rescue excavations in the House of Quintus Calpurnius Eutykhes. Triclinium with the mosaics of Achilles at Skyros (above) and Theonoe and Leukippe (below) dating from the 2nd-3rd centuries CE. (courtesy of CCA – Centro di Conservazione Archeologica)
The piers of the mid-12th century C bridge still standing in the Tigris river at Hasankeyf. The piers are expected to be flooded once the Ilısu dam will be fully operative. (Wikimedia commons)
The mid-12th century CE minaret of Halfeti partially submerged in the late 1990s by the water reservoir of the Birecik dam. (Wikimedia commons)

Despite these enormous losses, and while a lively debate took aim at both the expected outputs and the issues concerning land loss and resettlement, less attention was given to the impact of dams on cultural heritage. Archaeologists often avoided political stances, largely because they get their excavation permits from the same governments that are building the dams.

The OrientDams Project

The OrientDams initiative started in 2015 with the aim of quantifying the loss of archaeological heritage due to dams. It brought together a team of archaeologists and engineers from the University of Bologna directed by N. Marchetti, under the wider EU-funded JPI project “HeAT – Heritage and Threat” based at the University of Copenhagen with I. Thuesen as its coordinator, which aimed at systematically analyzing threats towards cultural heritage as well as developing tools and strategies to confront them.

For the scope of the OrientDams project we considered three rivers that played a key-role within the history of the MENA region: the Euphrates, the Tigris and the Nile. Thirteen existing dams and six in project were analyzed along the Euphrates and Tigris rivers from their northern springs in the Anatolian mountains, passing through the Syrian and Iraqi steppes down to the southern Mesopotamian floodplain. In Egypt we investigated the real extent of the damage caused to the archaeological sites by the two Aswan dams on the Nile, which created one of the largest artificial basins on earth.

To do so, our multi-disciplinary team applied an integrated methodology including archaeological and geo-spatial open-access datasets, organized in a webGIS in order to foster data sharing and research replicability. Archaeological data were retrieved from published report of surveys and excavations in dam reservoir areas, as well as from the webGIS TAY project, which provided georeferenced shapefiles of several archaeological sites in Turkey.

The OrientDams webGIS showing the distribution of dams in MENA countries. (Source: OrientLab)
The research methodology of the OrientDams team. After collecting all the available archaeological and geographical information, these have been processed in a GIS. The result shows the extent of damage to the archaeological sites caused by the increase of the water reservoir through time.

Geographical data included various spatial datasets and georeferenced satellite imagery. The former were acquired from the official websites and GIS platforms from the Turkish Ministry of Forestry and Water Affairs and the Food and Agriculture Organization’s “Aquastat project”, both of which provided the bulk of information for dams and water reservoirs. The second group of geographical data was collected from the US Geological Survey EarthExplorer website and consisted of multi-temporal satellite imagery taken since the 1970s until today, which were processed to reconstruct the extension of the water reservoir of the dams through time.

By cross-correlating the archaeological sites in surveyed areas with the extensions of the water reservoirs, we were able to precisely determine the number of sites actually submerged by the dams through time. As a result, the team identified almost 2500 archaeological sites along approximately 1300 km of the three rivers flooded by dams. This datum is even more striking when considering that their number is most likely an incomplete one, as large parts of the reservoir areas have not been systematically investigated by the archaeologists.

The impact of dams along the Euphrates river. From north to south the eight most destructive dams are shown, five in Turkey (Keban, Karakaya, Atatürk, Birecik, Karkamış), Syria (Tishrin, Tabqa) and Iraq (Haditha). Red dots indicate archaeological sites, the blue lines represent the water reservoirs extensions, while the yellow surface shows the extension of the archaeological survey areas.

One of the most striking results was highlighted by the study of the Aswan dams. Indeed, while the public and most of the academic community have in mind the spectacular rescue of several monuments at Abu Simbel and Philae, most archaeological sites were totally neglected or only poorly documented. In order to provide a comprehensive picture of the damage caused by the Aswan dams, the OrientDams team systematically collected all the available documentation about the archeological researches prior to the construction of the dams.

In total 1753 flooded heritage sites were identified, including 781 ancient cemeteries, 392 settlements, 289 rock art places, 103 temples and churches. The research also revealed that only half of the total reservoir area (52%) had been surveyed, thus suggesting a remarkably higher number of archaeological sites lost under the water of Lake Nasser.

The reassembling of the statue of Ramses II at the Great Temple of Abu Simbel in 1967 after having been moved in order to save it from the Aswan dam flooding. (Wikimedia commons)
Investigating the real impact of the Aswan dam on the archaeological sites by georeferencing in a GIS software an old map with the location of several ancient sites.
The impact of the Aswan dam on the Egyptian cultural heritage. To the left, the location of the different types of heritage places (1753) submerged by the water reservoir. To the right the extension of the area surveyed by archaeologists corresponding to 52% of the Lake Nasser area.

A Systematic Safeguarding of Archaeological Sites Threatened by Dams: A Story yet to be Written

Our research provided an unprecedented overview of the destruction of the cultural heritage perpetrated along some of the most important rivers of world history. The results of these researches are now available through our webGIS, together with the open-access scientific and more popular papers.

The research conducted by the OrientDams team would ideally contribute to raise awareness on the issue of endangered heritage due to development projects, such as dams, and on the related needs of documentation protocols and strategies.

To date, activities and projects aiming at protecting the archaeological sites and monuments are generally missing or only partially included within the master plans for major dam projects. For example, the great number of dams currently under construction in Turkey is not paralleled by an equal number of survey and rescue excavation projects. In this regard, several scholars around the world stressed the need for strategies and working protocols to document and safeguard archaeological sites and monuments in the planning of hydraulic infrastructures at international, national and local levels. Funders of development works, foremost the World Bank, should review their current policies, which offer insufficient protection to cultural heritage.

We hope that more studies about the impact of dams and large infrastructures on cultural heritage worldwide will appear soon, for the benefit of both policy-makers and the general public, especially in balancing long-term costs and advantages (thus far insufficiently evaluated) in order to implement more effective safeguarding policies and more sustainable development projects.

Nicolò Marchetti is a Full Professor of Archaeology of the Ancient Near East at the Department of History and Cultures, University of Bologna, Italy. He directs excavations at Karkemish in Turkey and at Nineveh in Iraq and is the scientific editor of Orientlab.

Federico Zaina is Research Fellow in Archaeology of the Ancient Near East at the Department of History and Cultures, University of Bologna, Italy. He is a Shelby White and Leon Levy grantee at the Polytechnic University of Milan.

Further reading:

Marchetti, N., Bitelli, G., Franci, F. and Zaina, F. 2020. Archaeology and Dams in South-eastern Turkey. Applying Post-Flooding Damage Assessment to Improve Current Documentation and Safeguarding Strategies on Cultural Heritage, Journal of Mediterranean Archaeology 33.1 (in press).

Marchetti, N., Curci, A., Gatto, M.C., Nicolini, S., Mühl, S. and Zaina, F. 2019. A Multi-scalar Approach for Assessing the Impact of Dams on the Cultural Heritage in the Middle East and Northern Africa, Journal of Cultural Heritage 37: 17-28.

Marchetti, N. and Zaina, F. 2018. Documenting Submerged Cultural Heritage. Dams and Archaeology in South-eastern Turkey. In M. Kinzel, M.B. Thuesen and I. Thuesen (eds.), Culture and Conflict. Understanding Threats to Heritage, Copenhagen, Orbis: 28-35.


  • « Previous Page
  • 1
  • …
  • 4
  • 5
  • 6
  • 7
  • 8
  • 9
  • Next Page »